

 ·
6 minute read
·
6 minute read

How do customers react when presented with different prices? How does their willingness-to-pay vary by segment or country, or how does it change over time, either organically or when subjected to stimuli? PriceBeam runs many studies around the world and we have collected some of the general insights and trends from willingness-to-pay studies in 2019.
Current Price is not the Optimal Price
One key output from PriceBeam's analytics is to find the optimal price on a demand curve:
Where the curves peak is the optimal price, based on either quantity, revenue, or margin. If a price is to the left of the peak, then the product is under-priced: the average customers' willingness-to-pay is higher than the price, or could lead to higher revenue / margin if the price was increased. Similarly, if the the price is to the right of the peak, then the product is over-priced: more quantity/revenue/margin could be achieved by lowering the price.
The result from our studies during 2019 reveal that when accepting plus/minus 5% deviation from the peak as being optimal, then in 85% of all cases current price is not the optimal price.In other words, 85% of all prices could be improved.
Willingness-to-Pay for the Same Product Always Differs Across Countries
The willingness-to-pay for an iPhone among consumers in USA is different from the consumer WtP in Germany or Australia. Ditto for shoes, TVs or cars. Or for a business buying production components, cleaning services or customer service software. Willingness-to-pay always differs from country to country.
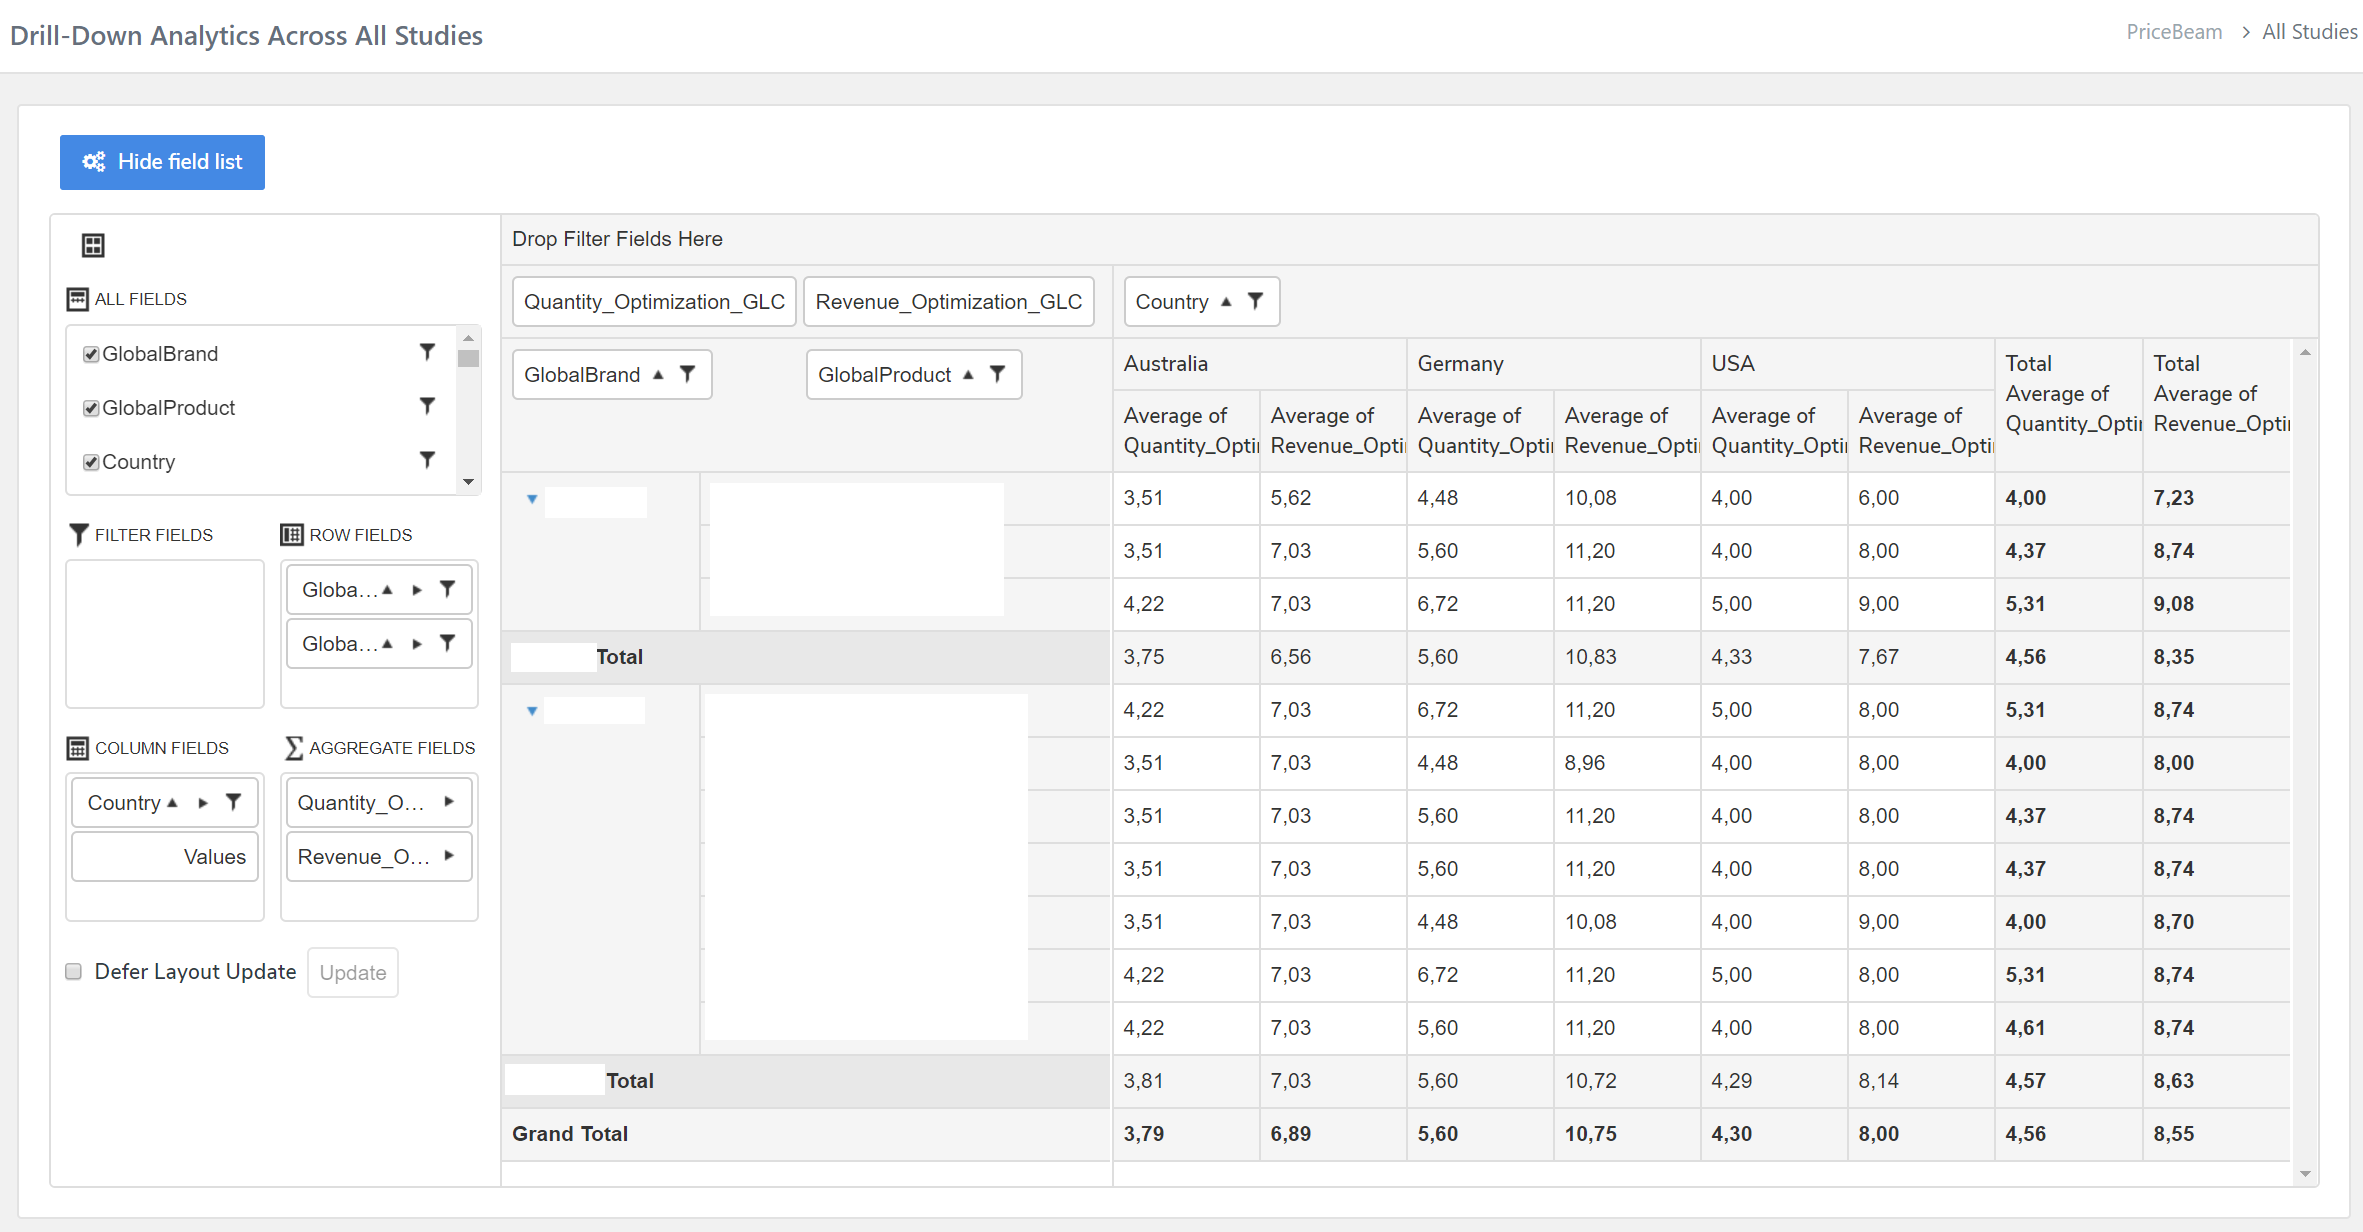
The above example contains optimal price points from Australia, Germany and USA converted into US Dollars. Across the range, there are distinct differences between the countries, even for the same product (compare horizontally). PriceBeam's research always invariably shows such differences.
Psychologically speaking it also makes perfect sense. People have different needs and put different values of features or benefits. This is the case inside a single city, state or country. So of course it also the case that a German customer has a different view of the product's value than an American customer.
The meaning for management should also be clear: you MUST understand the different levels of willingness-to-pay in the countries you operate in, typically through price research. In the old days this might have been rather costly but with automated, predictive price research such as PriceBeam, you cover 10-20-30 markets or more at the cost of just one of the old-fashioned methods.
Willingness-to-Pay Varies Significantly by Segment
What someone is willing to pay for a bowl of soup, a newspaper subscription, an iPhone, or a 12 months CRM subscription is highly individual and based on that person's assessment of the value she or he gets or perceives to get. In pricing theory, it is also expected that different customer segments have different willingness-to-pay:
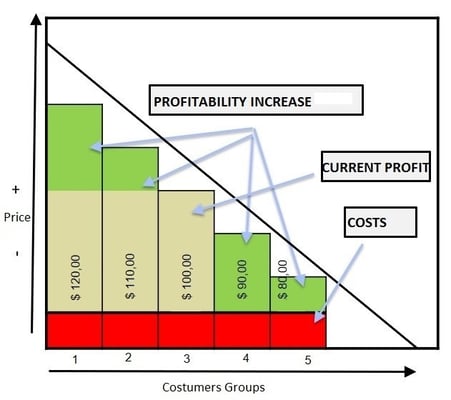
The theory goes that by differentiating the value and the price to different segments' willingness-to-pay, the vendor can achieve higher profitability.
So what does actual market data say? Well, the theory is strongly confirmed by PriceBeam's research studies around the globe. Different segments in both B2C and B2B exhibit variances in willingness-to-pay, and through research it is possible to pinpoint the differentiating factors and those implement the pricing theory to the benefit of the company's profit.
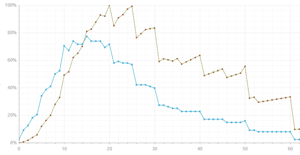 Using PriceBeam's built-in analytics, managers can analyze the willingness-to-pay for each segment, similar to the graph on the right. In there, it is evident that one segment has a higher WtP than the other segment, for the same product. By adjusting value communication as well as either the pricing logic (= what discounts and rebates are given to different segments), or by differentiating the actual product offering, the company can reap the profits from having one customer segment having 50% higher WtP than another.
Across different industries, such as consumer goods, financial services, travel & hotels, retail and e-commerce, software, industrial components and B2B services, PriceBeam has found that for the exact same product, the willingness-to-pay can vary by 100-400%, meaning that some segments are willing to pay 4 times the price as other segments. This is a huge profit potential and worthy of targeted sales, marketing and product development.
Bulk Buy = Bulk Reduction in Willingness-to-Pay
In consumer goods many assortment strategies use different pack sizes to occupy more shelf space and thus make a greater impact shelf impact. Also, some consumers only have little needs whereas others are heavy consumers and therefore interested in bulk buying. This is rather the norm in both consumer industries and many business-to-business industries as well.
When running PriceBeam price research studies we often test willingness-to-pay for different pack sizes. The following example (modified data for anonymity) illustrates a pattern that repeats itself across many industries, products and countries:
Brand pack sizes and WtP
| Pack size | Willingness-to-Pay | WtP per unit |
| 100ml | $2.99 | 0.0299 |
| 300ml | $4.99 | 0.0166 |
| 500ml | $6.99 | 0.0140 |
| 1000ml | $8.99 | 0.0089 |
The example is from a specific category in the the consumer goods industry in USA, but PriceBeam research shows the same pattern in many industries and countries around the globe.
- Customers do recognize that bigger pack sizes / larger volumes cost more than smaller units
- Customers expect that the built-in "discount", represented by the WtP per unit, to become bigger and bigger
- In some cases the drop in WtP/unit is so big that it really doesn't pay off to include such products in the range
When designing your range and deciding on pack sizes / volume metrics (also in B2B) it can be very useful to include market research like PriceBeam's to understand customer's perception and reactions to different sizes / different volume break-points. With it, you can much better optimize prices across the range.
Optimizing Quantity is Never Yielding Optimal Revenue $ nor Margin
A remarkable number of organizations still focus on market share measured by quantity. Read one of the earning reports from corporations e.g. selling phones (#handsets sold), or publishing or media companies (#subscribers), or even fast moving consumer goods manufacturers (#units sold), and you will find an obsession with increasing quantity sold.
Yes, it is indeed nice to sell many units but not at any price. PriceBeam's research shows that the highest possible revenue or the best overall margin (in absolute terms) is achieved at higher price points than the price through which most number of units are sold:
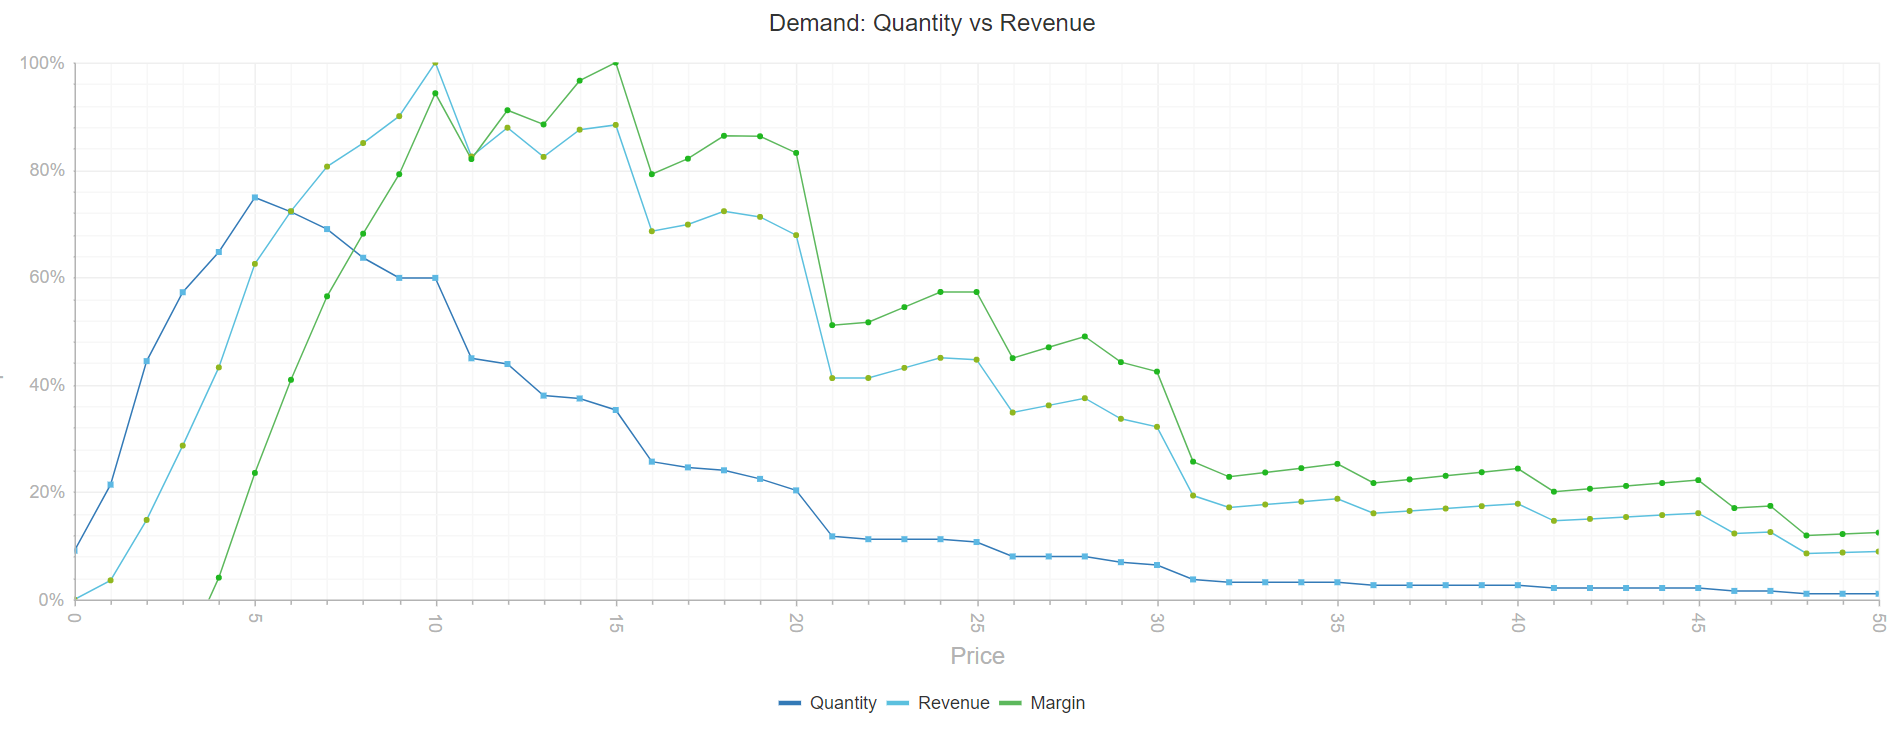
Take the above example: The first, blue curve shows the market demand in quantity-sold as a function of the price on the x-axis. Most quantity is predicted to be sold where the blue curve peaks, i.e. at a price of $5. However, the light blue curve with green dots (revenue) shows the predicted revenue (quantity X price) as a function of price. In that it is no longer $5 that is the optimal price, but rather the price of $10 where the revenue curve peaks. And taking it one step further, the green margin curve shows optimal margin (quantity X price - costs) at different price points, leading to the conclusion that to optimize margin, the best price is actually $15.
The logic is simple: the higher price more than makes up for the volume loss. You can e.g. compare look at the blue predictive demand curve and see that quantity sold indeed goes down when moving from $5 to $10 or $15, but that quantity reduction is more than compensated by increased revenue and increased margin from those higher price points.
Price research like this example is useful in several ways:
- It determines market dynamics such as optimal price points and price elasticity (the change in quantity or revenue when price changes)
- It identifies dangerous price cliffs, where quantity/revenue/margin drops off significantly once the price goes above (see e.g. $20 above)
- Internally, it helps organizations focus on the benefits of revenue and profit, rather than quantity sold
- Externally, this kind of analysis can help in negotiations with e.g. retailers about the merits of next year's price increase
Having a profit mind set really improves an organization's ability to make money. Create such a mindset through fact-based research.
Pricing Insights = Massive ROI
So what does a PriceBeam study cost is a frequent question. And while the factual answer is typically between 5K and 15K depending on scope, the real answer, or rather comeback, is that it costs nearly nothing in comparison to the hundreds of thousands, millions, or tens of millions that it brings you. Imagine some simple examples:
Case 1: A media company planning to launch a new subscription service. Investing less than 10K in pricing research they realized that the market would be willing to pay 25% more than originally thought when conceptualizing the subscription service. In the first 3 months after the launch, they made 500K in profits.
Case 2: A consumer goods manufacturer was assessing its range in a certain sub category in Australia. By using PriceBeam's analysis across 10 different SKUs in their range, they identified 3 products that each could have its price increased to reach the (much) higher consumer willingness-to-pay for those specific products and thus overall made 3.2 million more in profit in the 12 months to follow.
Case 3: A software company selling to various types of businesses reviewed both their own pricing and that of the competition using PriceBeam's research and found that customers were so fond of their software (fondness measured by willingness-to-pay of course) that they could implement a price increase amounting to 65% on average across their product catalogue.
Knowing what to do with prices instead of old-fashioned guesswork always yields massive ROI.
What are YOUR Customers Willing to Pay?
We know that PriceBeam's pricing studies and insights can improve prices, revenue and profits, and tremendous ROI rates. So how can we help you? Get in touch and book either a guided demo, and get started now. There is so much to gain and we can get you results in less than one week at costs starting at just a few thousand dollars.