.png?width=400&height=100&name=PBLogoTransparent%20(1).png)

 ·
3 minute read
·
3 minute read

Prices are almost never the same in international markets. They vary due to taxes, cost structures, local market needs, currency exchange rates, tariffs, differences in competitive situations and a myriad of other reasons. They even vary because this is the way it has always been. If looking at different industries, consumer products (CPG/FMCG) have more than 100% difference in prices, with even regional differences in e.g. the European Union of up to 50% for the same product. Car manufacturers are well-known for their price differences and even relatively global products such as computer software has had a number of bad PR cases where e.g. Australians would pay twice as much for Adobe software as US customers.
But international price differences are more good than bad. Here is why.
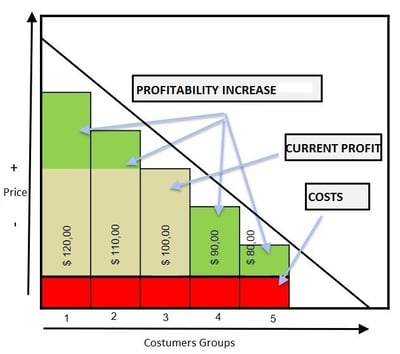 Not everybody is willing to pay the same. Some people are willing to pay more than $1000 for a phone; others only want to pay $200. The same really applies across nearly every product or service category. So what companies routinely do in their local markets is to segment the market and do product differentiation (e.g. iPhone X, iPhone XR, iPhone XS) to meet different levels of customer needs and levels of customer willingness-to-pay. Sometimes the product or service differentiation is even minimal (e.g. booking options) and the product nearly identical but still the price varies considerably, think e.g. flights, last-minute hotel rooms, concert tickets, etc. In other words: people are willing to pay different prices in a single market, and the sound pricing strategy to address this is to have multiple price points for the same or slightly varied product/service.
So by understanding willingness-to-pay in each market, you can optimize and differentiate prices accordingly. But wait, you might say. Running market research in 20 markets is costly and takes a long time, that we don't have. Well, that might have been true in the old days with old-fashioned market research, but not any longer. With PriceBeam's cloud-based, easy-to-use, and cost-efficient price research platform, you can get results from 20 markets in less than 2 weeks. And a small fraction of the cost, thanks to our innovative technology and approach.
Running price research for a single country can yield outputs such as the one below:
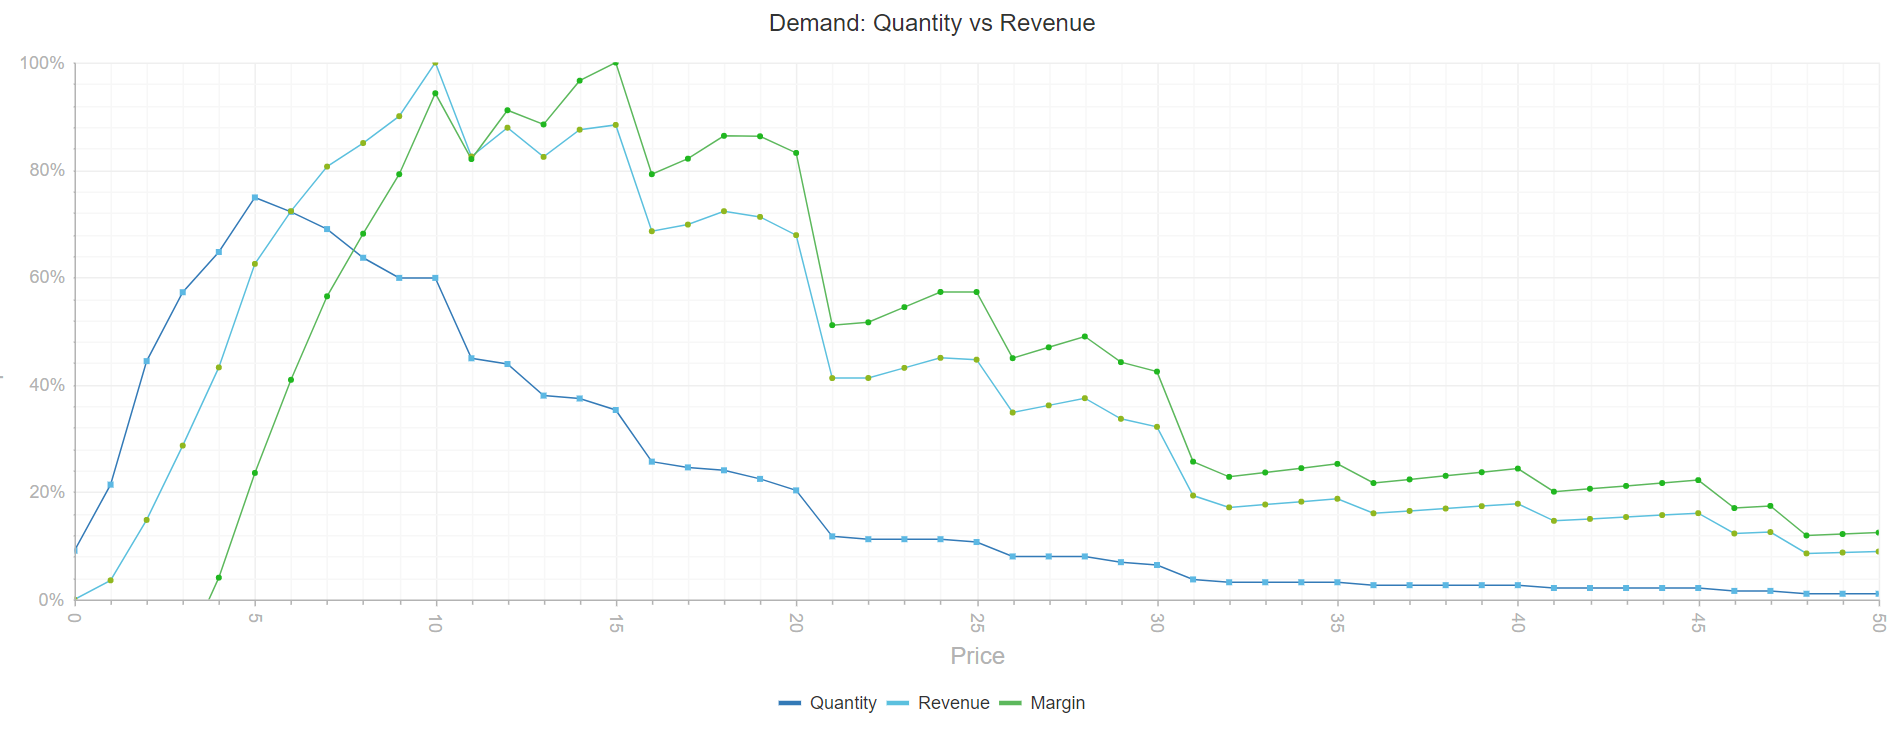
PriceBeam's system queries a number of respondents about their value perception and preferences, and then builds a virtual demand curve like the one above. The virtual demand curve is then used to generate 3 lines with different meanings:
- Quantity: predicted number of units sold. The highest number of units is where the dark blue curve peaks, i.e. at a price of 5.
- Revenue: this takes not only number of units sold into account, but also the price achieved at those volumes. This leads to the light blue curve, where the highest achievable revenue is where it peaks, i.e. in this example at a price of 10.
- Margin: the green curve takes both price, volume and marginal costs into consideration. The highest possible profit in the above example is thus at a price of 15, where the green curve peaks.
With this kind of modelling insights, managers can simulate different scenarios and for each (international) market. But wait, there is more. PriceBeam's platform can automatically manage the same study across multiple markets in a single go, without you having to worry about the details for each country. You simply choose to run the research in multiple markets and then PriceBeam's platform first duplicates the study and the adjusts it to local specifics such as language, currency etc.
When running international market studies in PriceBeam, the platform gives the insights for individual markets, but you can also easily and without additional effort also compare results across markets, like in the illustration below (fake data):
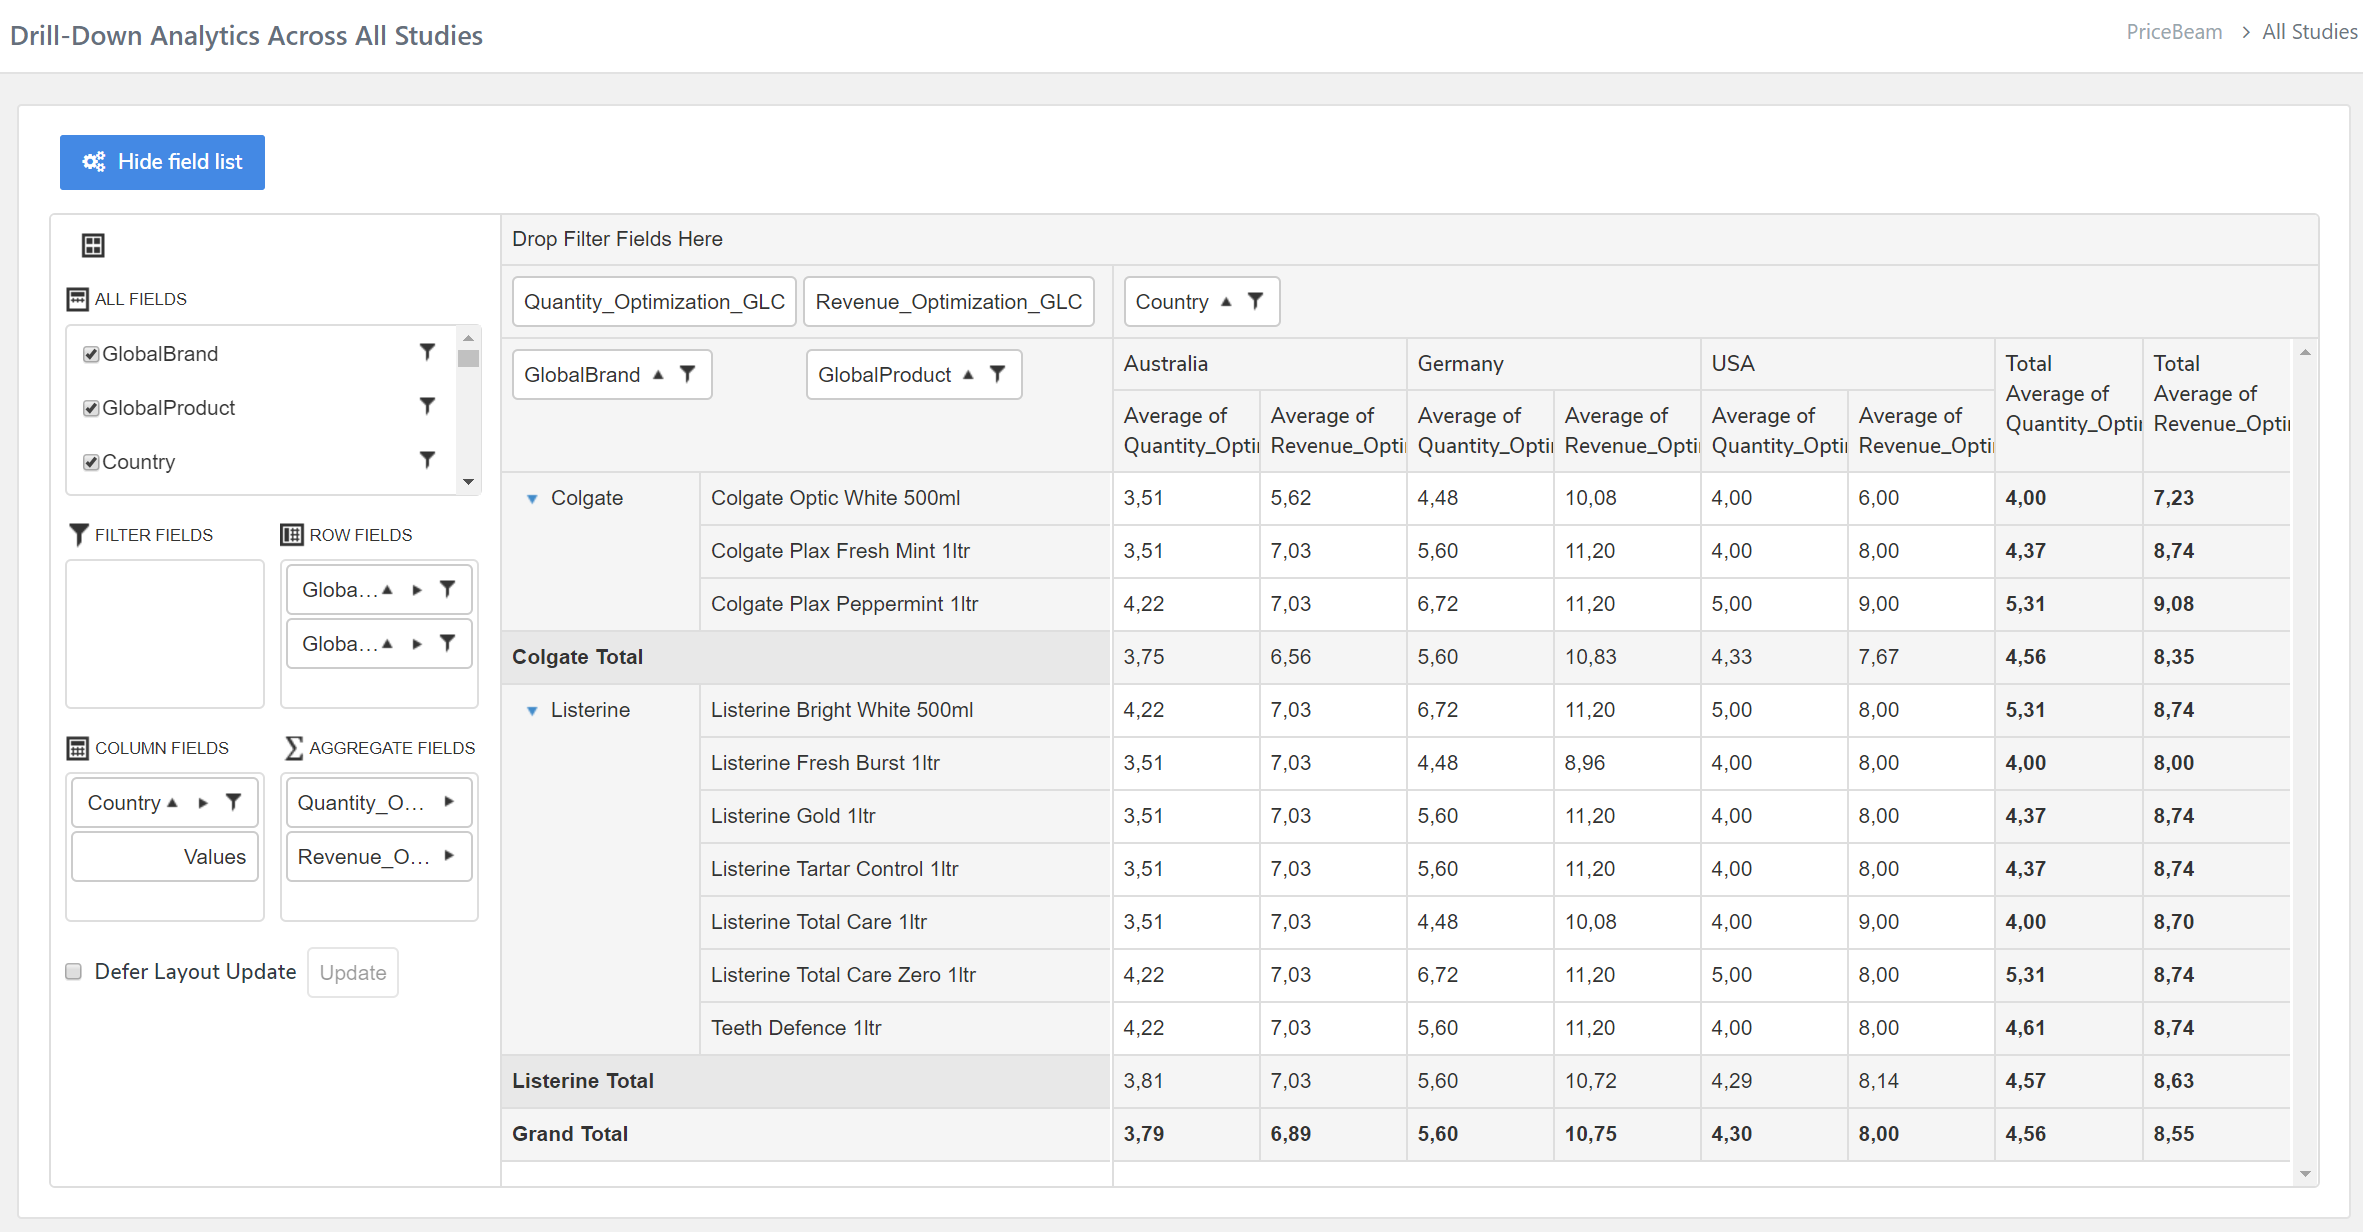
The analytics engine collects the various optimization points from each study, and then converts this into a comparable analysis, converting optimal prices in local currencies into a global currency, and also mapping local study products into a global product comparison. The result is a "map" that compares the results of each local market insight but across markets. International analysts and managers can even slice and dice the data by dragging the different data fields around the analytical canvas.
If you want to learn more about our international pricing capabilities, you should have a look at our special page about the topic.