.png?width=400&height=100&name=PBLogoTransparent%20(1).png)

 ·
3 minute read
·
3 minute read
What should the next price be? for a new product about to be launched? or an existing service where one wants to increase the price for any number of reasons? The facts are that in 88% of all cases the price setting process inside a company is largely based on guesswork and gut feeling rather than science. Or simply based on the previous price.
In current markets, guessing is riskier than it used to be. Willingness-to-Pay (WtP) can drift faster due to changing budgets, faster competitive imitation, and higher price transparency. That is why teams increasingly treat WtP as an input to decisions, not a one-off research project.
Setting the price for a new product
If you need to price a product (or service) in a new market, it makes all the difference in the world if you understand customers' WtP.
The practical question is not “what is the WtP number?” It is “where are the thresholds, which segments behave differently, and what happens if we change the offer (pack, features, service, or promo conditions) rather than only changing the price?
In current markets, guessing is riskier than it used to be. WtP can drift faster due to changing budgets, faster competitive imitation, and higher price transparency. That is why teams increasingly treat WtP as an input to decisions, not a one-off research project.
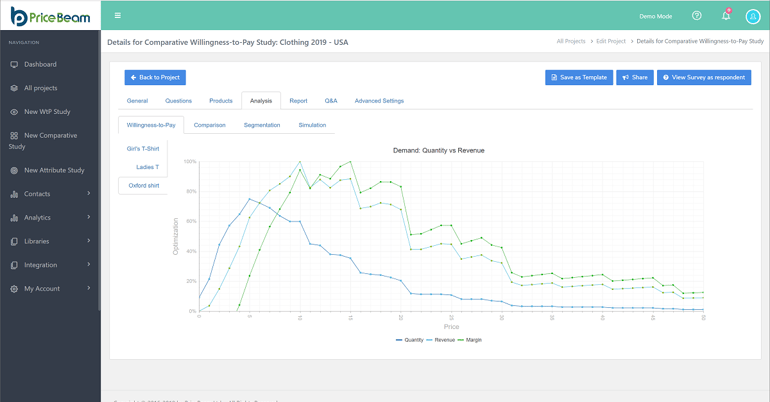
Demand / WtP curves like the ones below, show the optimal price point where the curve peaks.
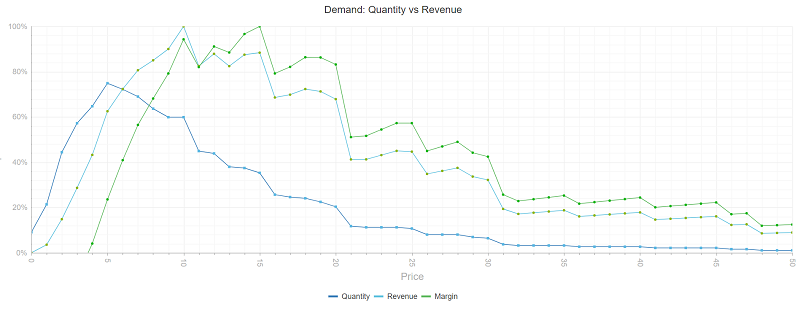
In this example, the best price to optimize quantity is 5, whereas the optimal price for optimizing revenue is 10, but a full 15 if going after optimizing margin. The way this kind of insight is generated is by having PriceBeam's system querying a number of consumers or businesses about their value perception, preferences and then building a virtual demand curve like the one above. The virtual demand curve is then used to generate 3 lines with different meanings:
- Quantity: predicted number of units sold. The highest number of units is where the dark blue curve peaks, i.e. at a price of 5.
- Revenue: this takes not only number of units sold into account, but also the price achieved at those volumes. This leads to the light blue curve, where the highest achievable revenue is where it peaks, i.e. in this example at a price of 10.
- Margin: the green curve takes both price, volume and marginal costs into consideration. The highest possible profit in the above example is thus at a price of 15, where the green curve peaks.
With this kind of modelling insights, managers can simulate different scenarios and for each (international) market. But wait, there is more. PriceBeam's platform can automatically manage the same study across multiple markets in a single go, without you having to worry about the details for each country. You simply choose to run the research in multiple markets and then PriceBeam's platform first duplicates the study, and then adjusts it to local specifics such as language, currency etc.
When research was expensive and slow, teams often avoided re-validating willingness to pay and relied on assumptions. Today, faster and more cost-effective approaches make it practical to measure WtP in time for real decisions, not months after the fact. The key shift is not technology for its own sake. It is decision speed with evidence you trust.
Managing the prices in a range
With PriceBeam's platform one can also, with a few clicks produce a number of other analyses. One of them is this kind of comparison of virtual demand curves in an assortment comparison:
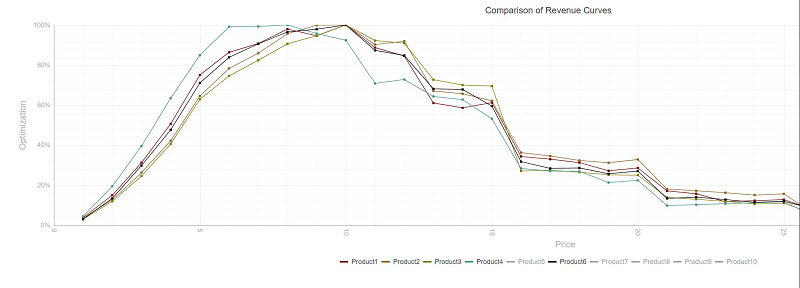
The 5 highlighted products (1, 2, 3, 4 and 6) are all from the same brand, but different line extensions. One of the conclusions here is that for the target segment there is a problem that while Product 4 has a distinct value profile, the other four are too close to each other in terms of WtP at least, as consumers have a more or less same value perception. While the 4 overlapping products may have other relevant benefits, one of the actions taken by the company in question was to take two of the product extensions up in price to 11.99, in this case products 2 and 3 as they have a higher WtP profile at higher price points.
Increased Pricing Professionalism with Modern Technology
In the old days of market research, the kind of insights above would take months and cost even 6 figures in dollars for just a single study. That is probably one of the reasons why the pricing process is governed by guesswork in 88% of all cases.
If you want to go deeper, see: Stop Guessing, Start Testing with Test-Driven Price Optimization (TDPO).
However, with a modern technology platform like PriceBeam, such studies can be done at a fraction of the cost and just in matter of days, even in 127 countries around the world, while maintaining the high quality and scientific accuracy. If you world like a talk about it might work for your business, please sign up for a free demo here.