.png?width=400&height=100&name=PBLogoTransparent%20(1).png)

 ·
4 minute read
·
4 minute read
Inflation means that prices are changing. It also means that consumers and customers change their perceptions with it. At least some of the time, though not all the time. So in inflationary times and inflationary markets, it is important for vendors to stay up-to-date on their consumers' willingness-to-pay.
PriceBeam has recently done a series of consumer research studies, comparing willingness-to-pay for the same brands and products in 2022 against what it was in 2021. The learnings are important and carries implications for all revenue growth teams.
In the example below are the Revenue Optimization curves for a well-known Consumer Goods brand in one of their key markets. It predicts consumer willingness-to-pay at different hypothetical price points plotted along the horizontal axis. This company ran a PriceBeam willingness-to-pay study in September 2021 and then repeated the same study one year later, to see how WtP had shifted, if at all.
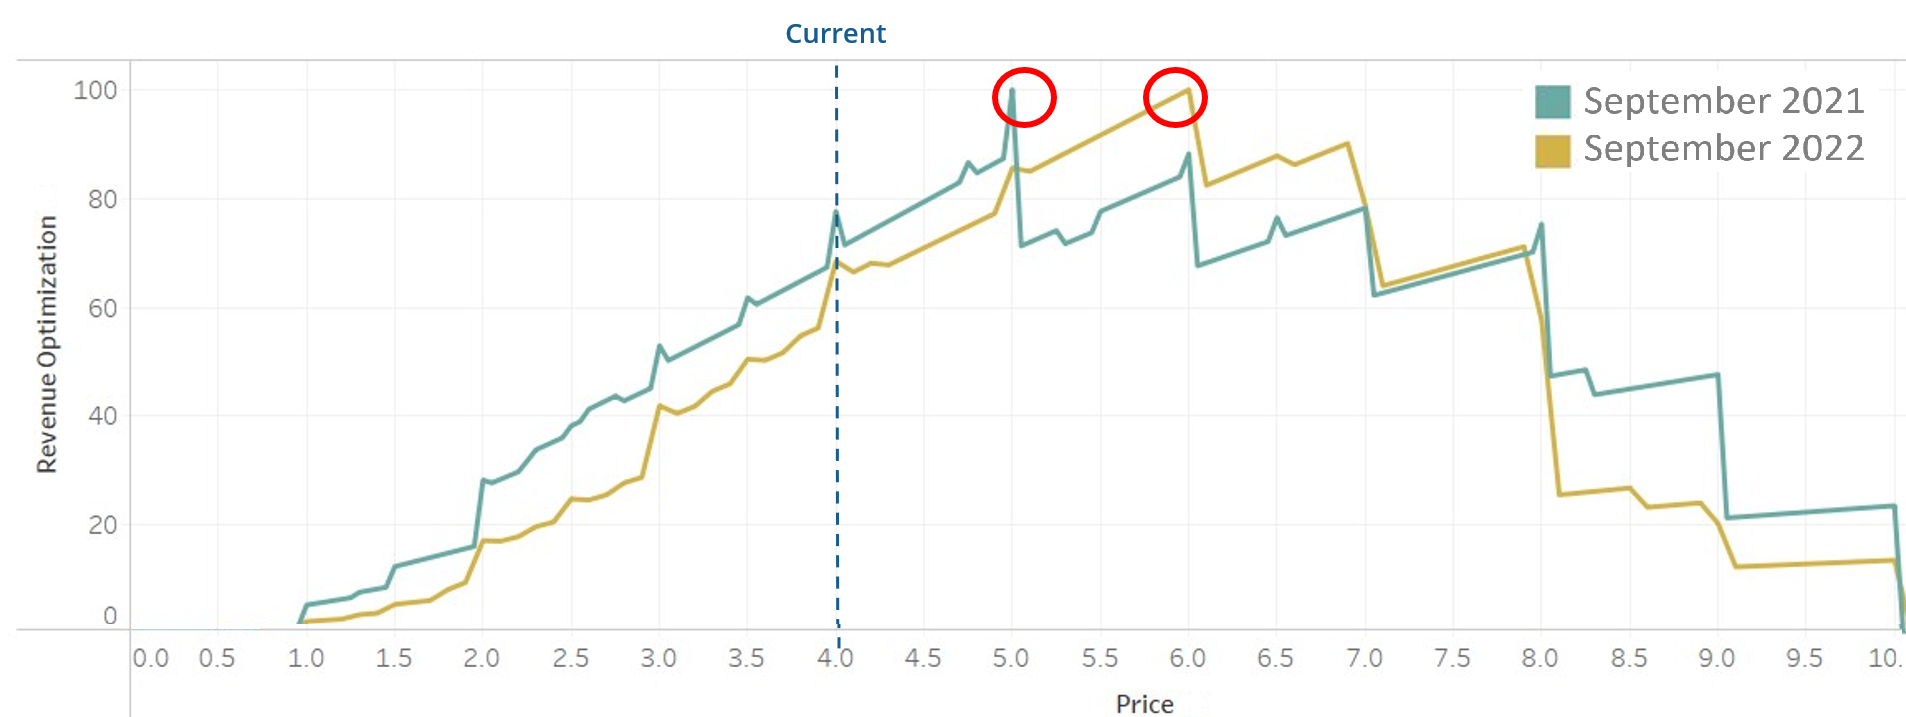
In the example, the willingness-to-pay curve for 2022 has shifted to the right, suggesting that consumer WtP has gone up in this high-inflation market.
Of course, the market research didn't just cover one single product but rather a range of products. PriceBeam has also conducted a series of similar studies that compare willingness-to-pay over time for other clients. All these comparisons of WtP over the last 12-18 months reveal a number of learnings.
Learning #1: Willingness-to-pay changes in both inflationary markets and non-inflationary markets
Inflation conditions consumers to that prices are changing. More so if inflation is either high or persistent over time. From different countries with varying levels of inflation, we can see that:
- Willingness-to-Pay starts to drift when inflation has been higher than normal for 6-9 months, all other things equal. Of course WtP can also change from marketing activities, supply issues such as scarcity, and other factors.
- For everyday, regular to high frequency purchase consumer goods, there is a correlation between WtP and inflation, so the higher the inflation, the more does WtP drift.
- For special, low-frequency purchases: inflation has less of an influence over willingness-to-pay, though the presence of inflation does make some price increases easier to sell into the trade channels.
Persistent inflation over longer time drives willingness-to-pay up more than sporadic inflation.
Learning #2: Don't Rely on Data Mining of Historical Data for Pricing
Some revenue growth managers use historical sell-out data to build models for optimal prices and price elasticity. If historical data suggests a given price elasticity, or the historical data delivers a certain regression or ML model, then such models are supposed to predict also future reactions to price changes.
What our studies have shown is that historical modelling certainly can give indications of in which direction price sensitivity goes,. However, almost by definition, historical models become less good at predicting the future, especially in markets with higher-than-normal inflation. Having to tighten the household expenditure or simply seeing prices go up means that consumers change behaviour versus the situation a year ago. Some buy few items but at the same spend level; others switch products to cheaper brands; others again leave the category all together. It is difficult for historical models to predict this, whereas forward-looking market research is much better at reflecting drifts in value perception and WtP.
Learning #3: Don't Rely on Guesswork for Price Setting
Surveys among people responsible for setting prices have shown that 88% of all pricing decisions are made using guesswork, gut instinct, cost plus, or somehow just based on last year's price. In a market where prices and WtP are fluctuating, this is almost instinctively wrong. If you don't know where consumers were last year in terms of willingness-to-pay or value perception, how can you possible guess it this year after the market experienced various price increases?
A related issue with guesswork pricing is also that sometimes pricing managers then push for "if inflation is 10% then we should also raise our prices by 10%". One might be lucky with this approach, but as we have also demonstrated in other blog articles, when you take a portfolio approach with many markets and/or many products, then some consumers will have a higher WtP than the current price and some will have a lower WtP than the current price:
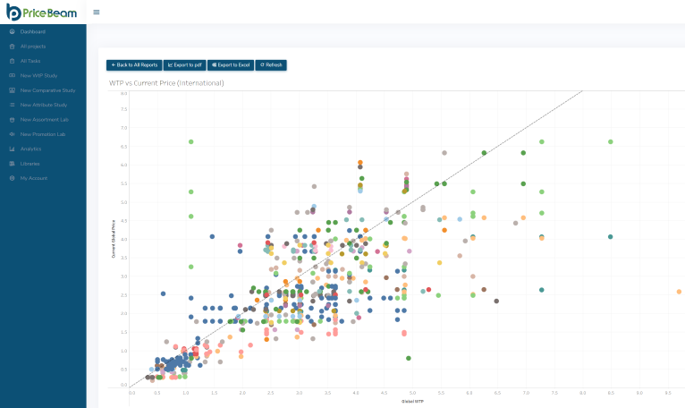
In this example each dot represents a product in a given market. The colours denote different product categories or different countries. On the horizontal axis we plot the willingness-to-pay peak for each product, and on the vertical axis the current price. Two distinct groups of products they occur:
- Price Increase Surpluses: when the WtP is higher than the current price, covered by all dots to the lower right of the straight line, then there is, all other things equal, an opportunity to increase prices as consumers are actually willing to pay more for those products.
- Price Increase Deficits: when current price is higher than WtP, then consumers have an issue with the product's value. These are the dots to the top left of the straight line. For these products a price increase may have detrimental effects.
In-depth insights into willingness-to-pay can help creating a more elaborate price increase plan.
Learning #4: Update Market Insights about Pricing on a Regular Basis
Many managers may in the past 30 years have gotten used to that, at least in North America and Europe, prices don't increase much, with lower single-digit inflation. However, with the inflationary pressures seen the past two years, it is time to also reconsider the sources of insights, and how often those sources are refreshed.
At PriceBeam we see that willingness-to-pay curves change significantly after 6-9 months, so we recommend in the current environment to update WtP insights at least once per year.
Conclusion
With higher-than-normal inflation, we have seen that consumers' willingness-to-pay sometimes, almost automatically, increases as well as the inflationary sentiments and news full of stories of price increases condition the consumer to expect higher prices. For Revenue Growth Managers this means that must stay on top of these changes through market insights, and run these market studies every 9-12 months.
Get in touch with PriceBeam if you want to learn how you can with 1-2 weeks get accurate and cost-effective insights into what your consumers are willing to pay.